

Wait! Before You Go…
Let Aviox Technologies give your idea the edge it deserves — with a free:
- 🚀 Smart Project Blueprint
- 💰 Accurate Cost & Resource Estimate
- 📅 Launch Timeline Strategy
Dell Server Analysis is a data analytics and visualization platform designed to help organizations monitor, evaluate, and optimize the performance of their Dell server infrastructure.

 Project Overview
Dell Server Analysis is a data analytics and visualization platform designed to help organizations monitor, evaluate, and optimize the performance of their Dell server infrastructure. The system aggregates server performance metrics such as CPU usage, memory utilization, storage health, and network throughput, enabling data-driven decision-making to improve efficiency and reduce downtime.
The goal of the project was to create an intuitive monitoring dashboard that transforms raw server data into actionable insights for IT teams and business stakeholders.
Website Overview
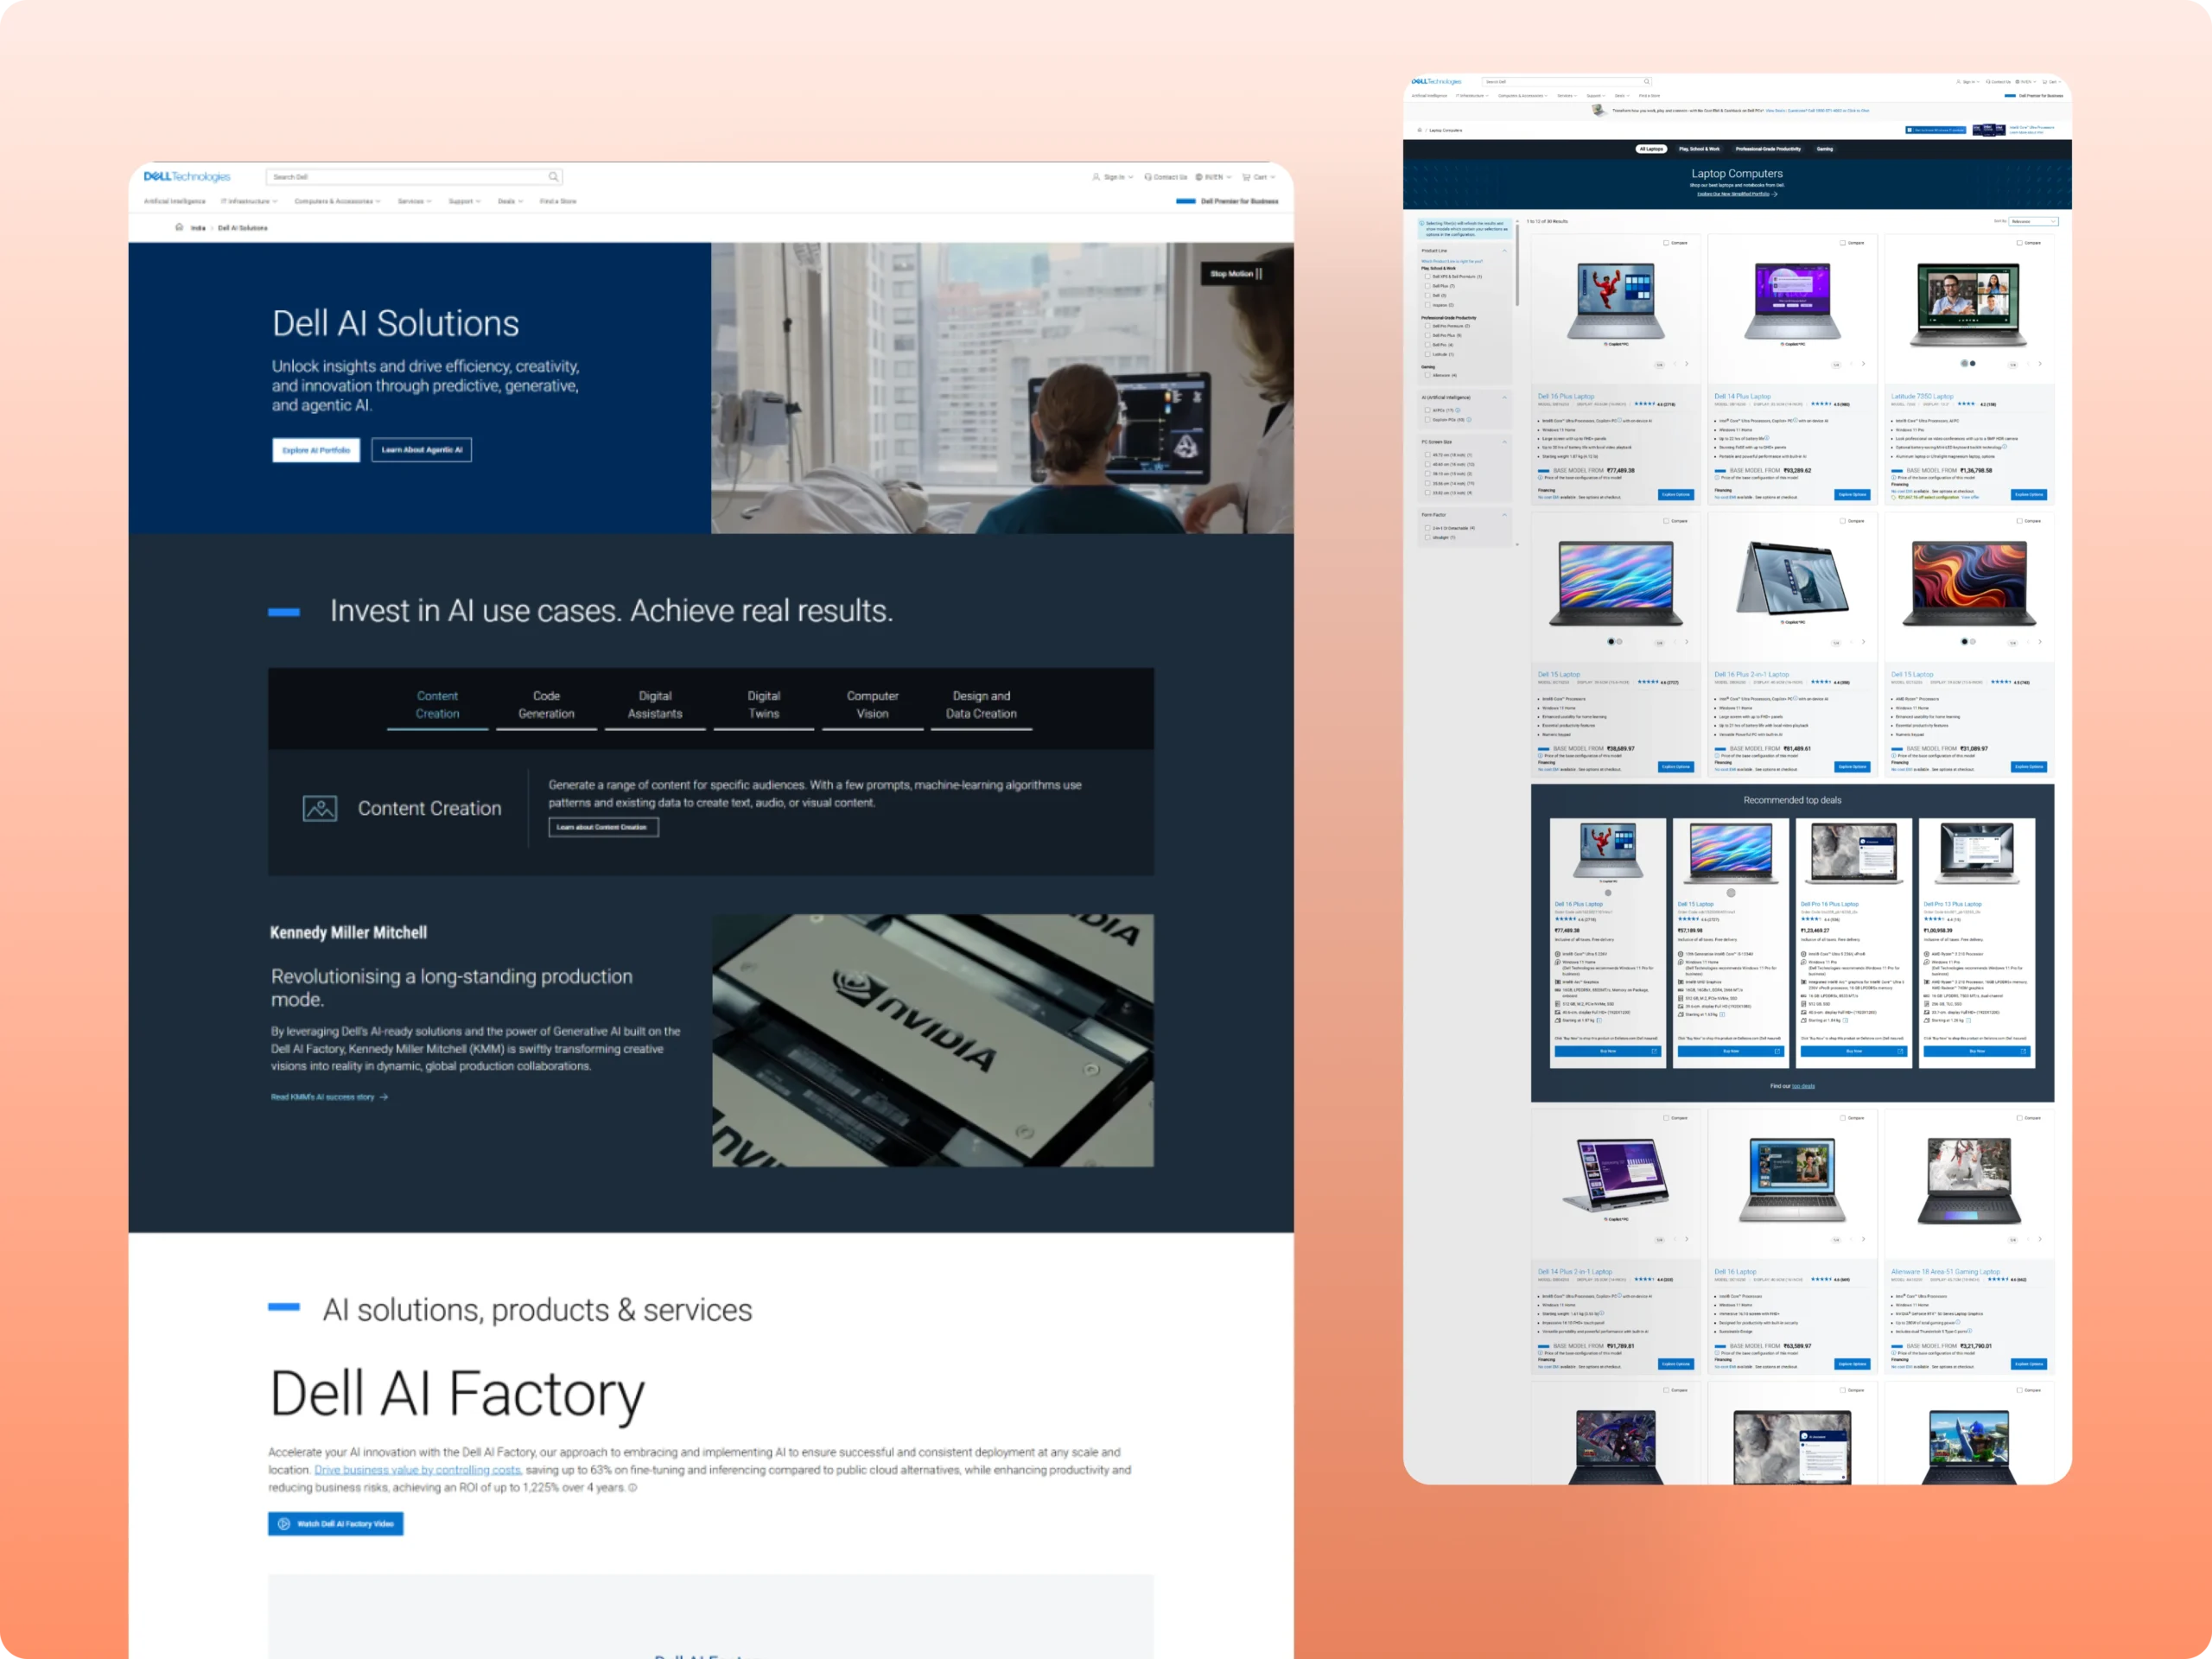
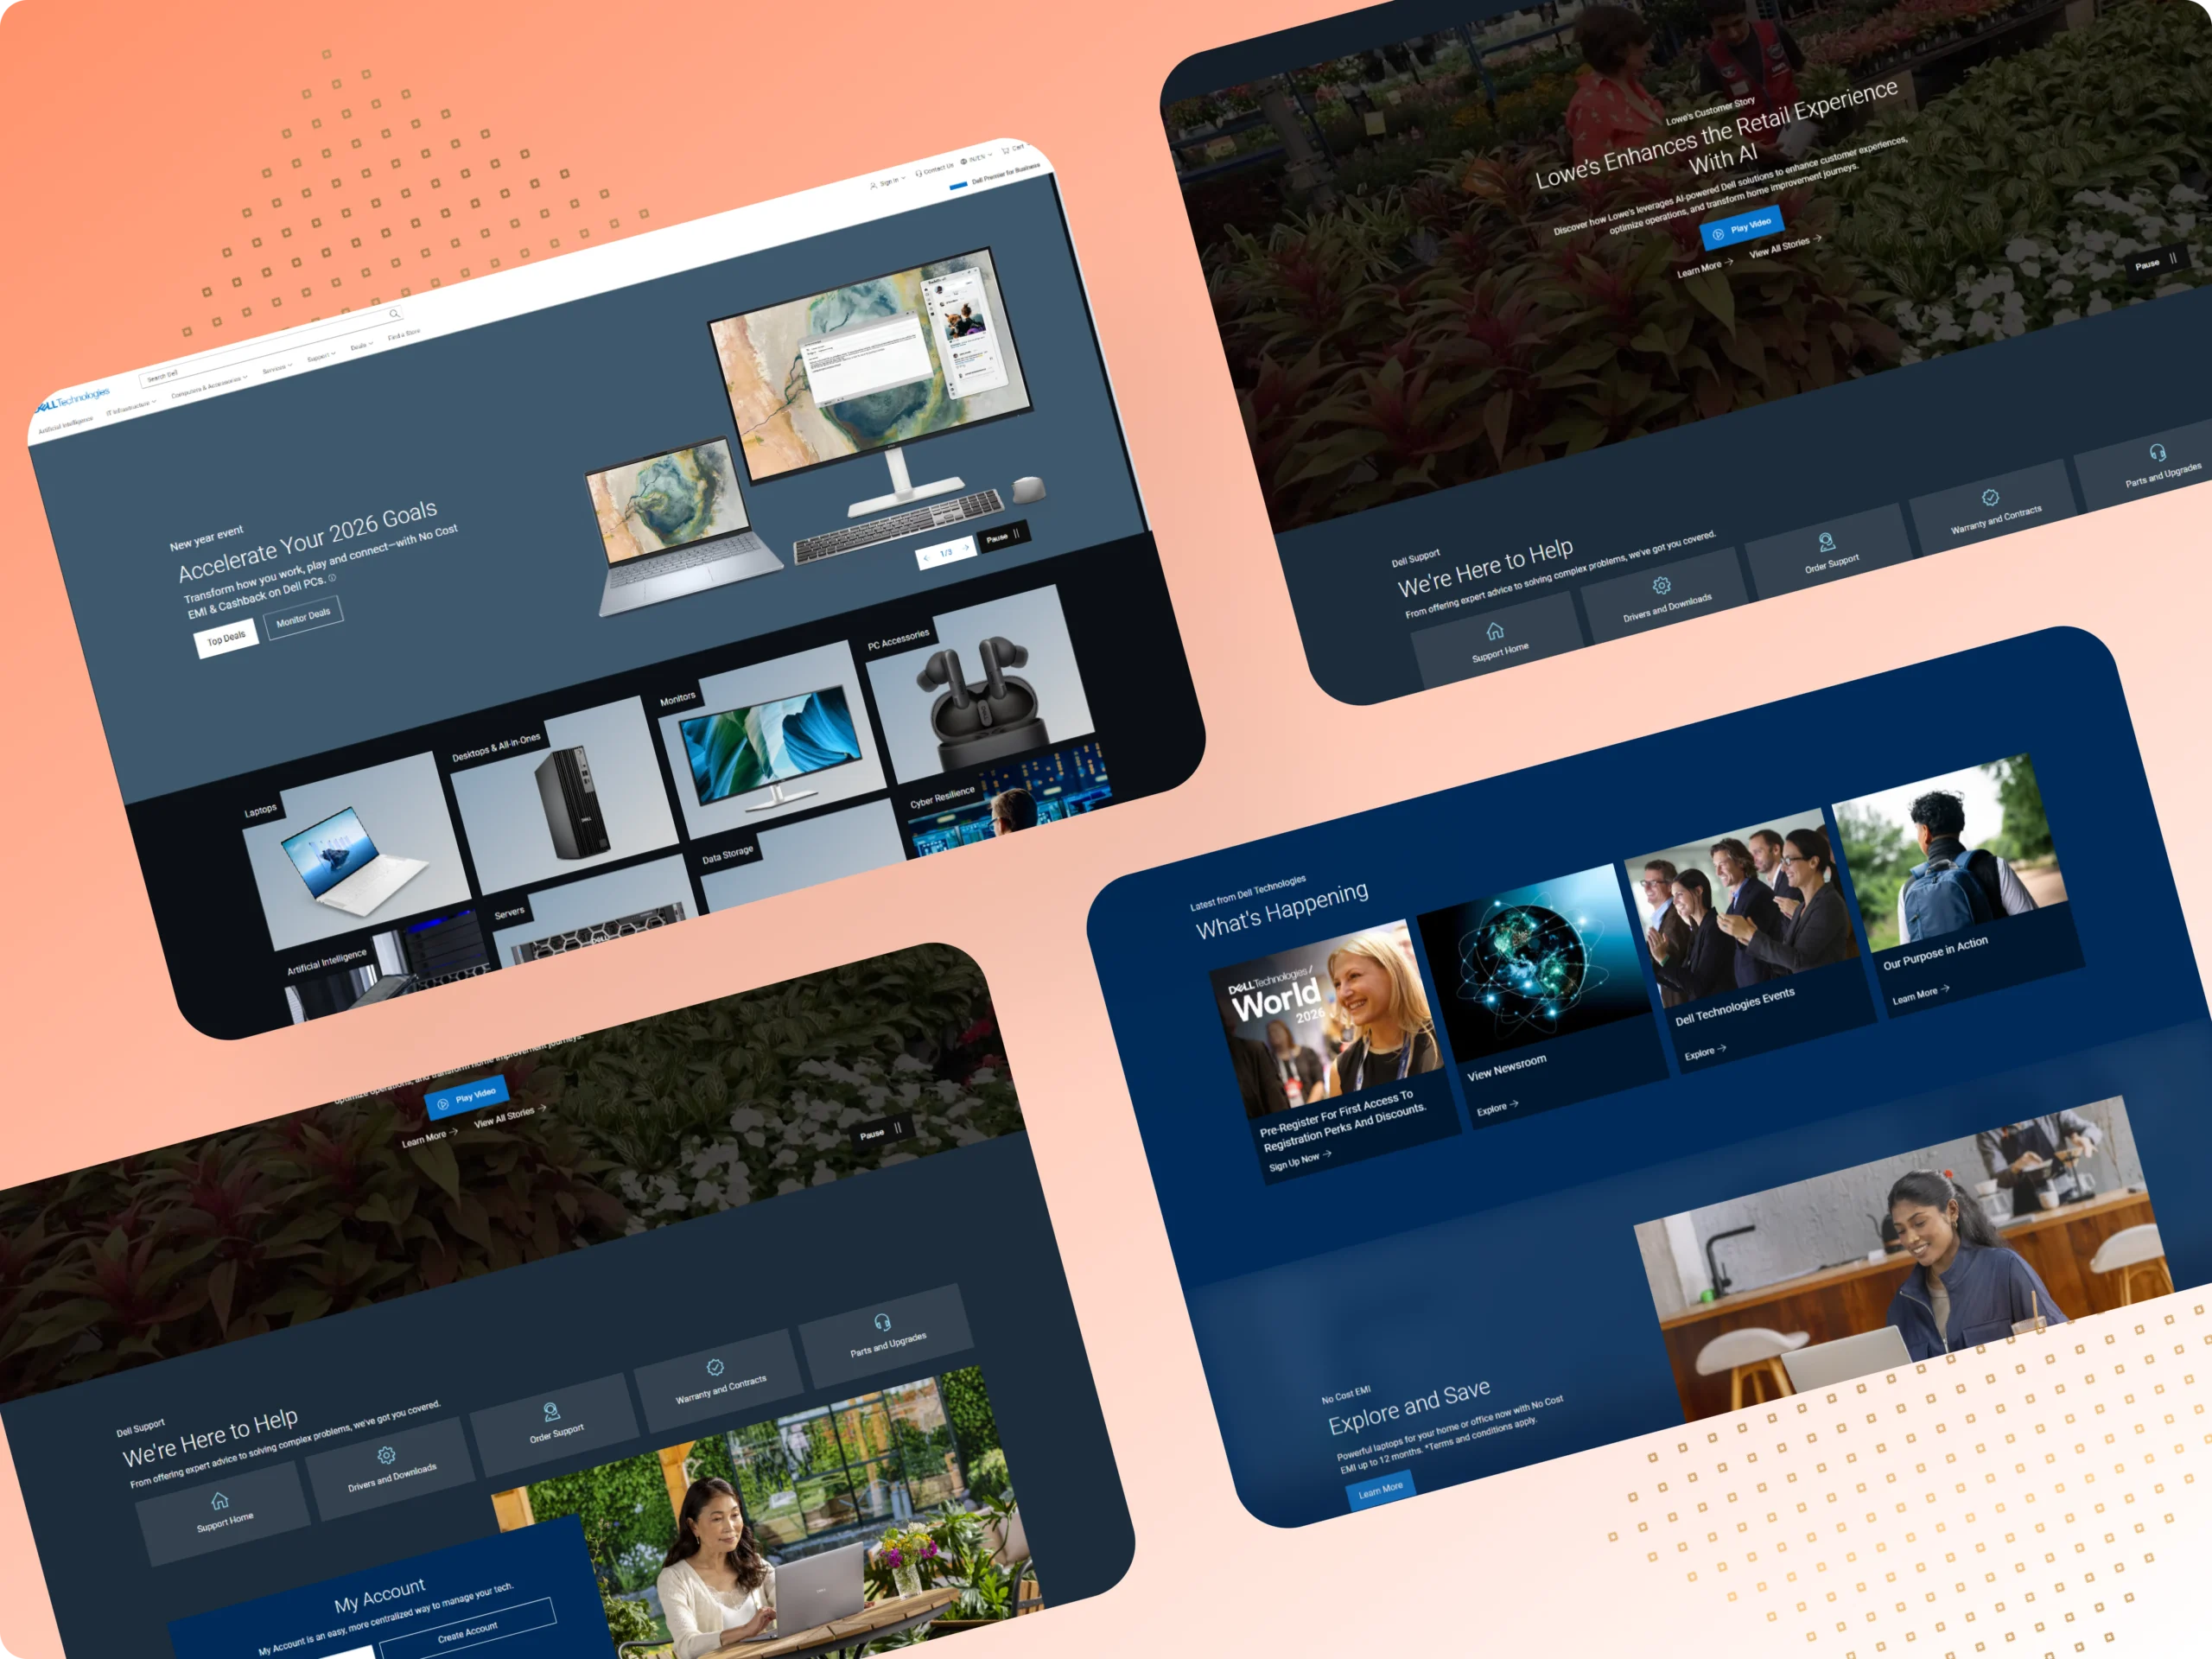
Home Page Overview
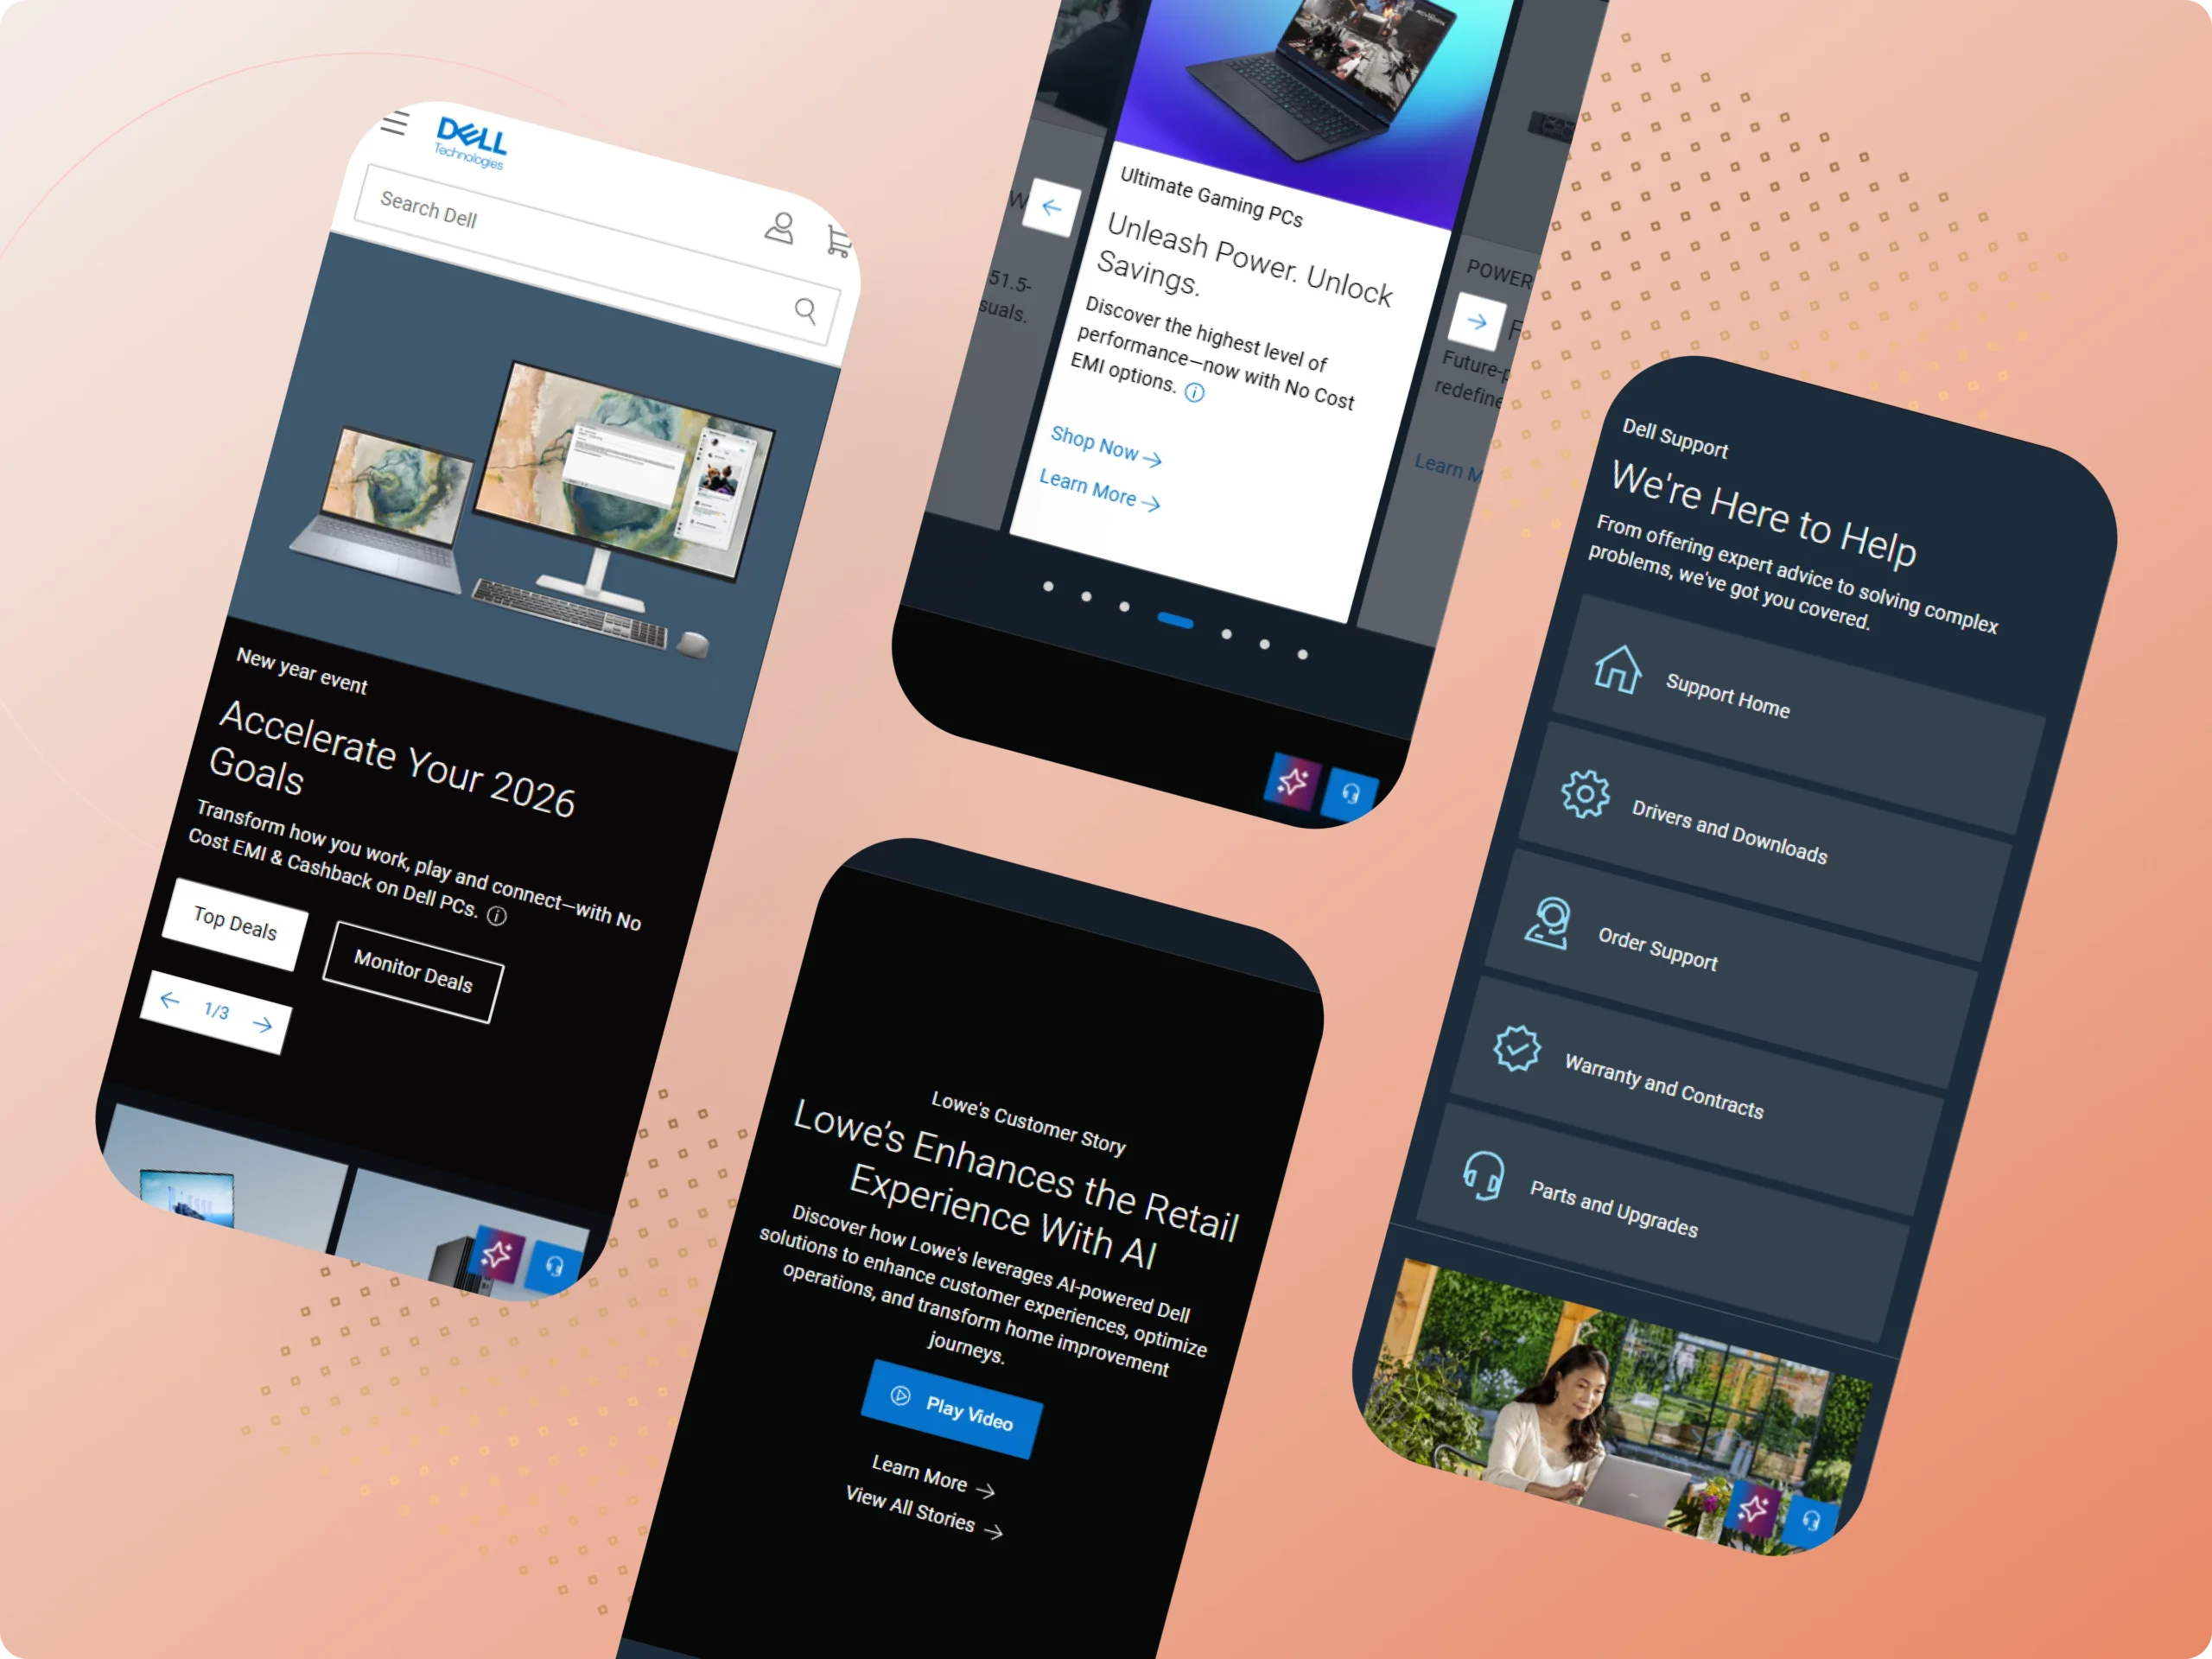
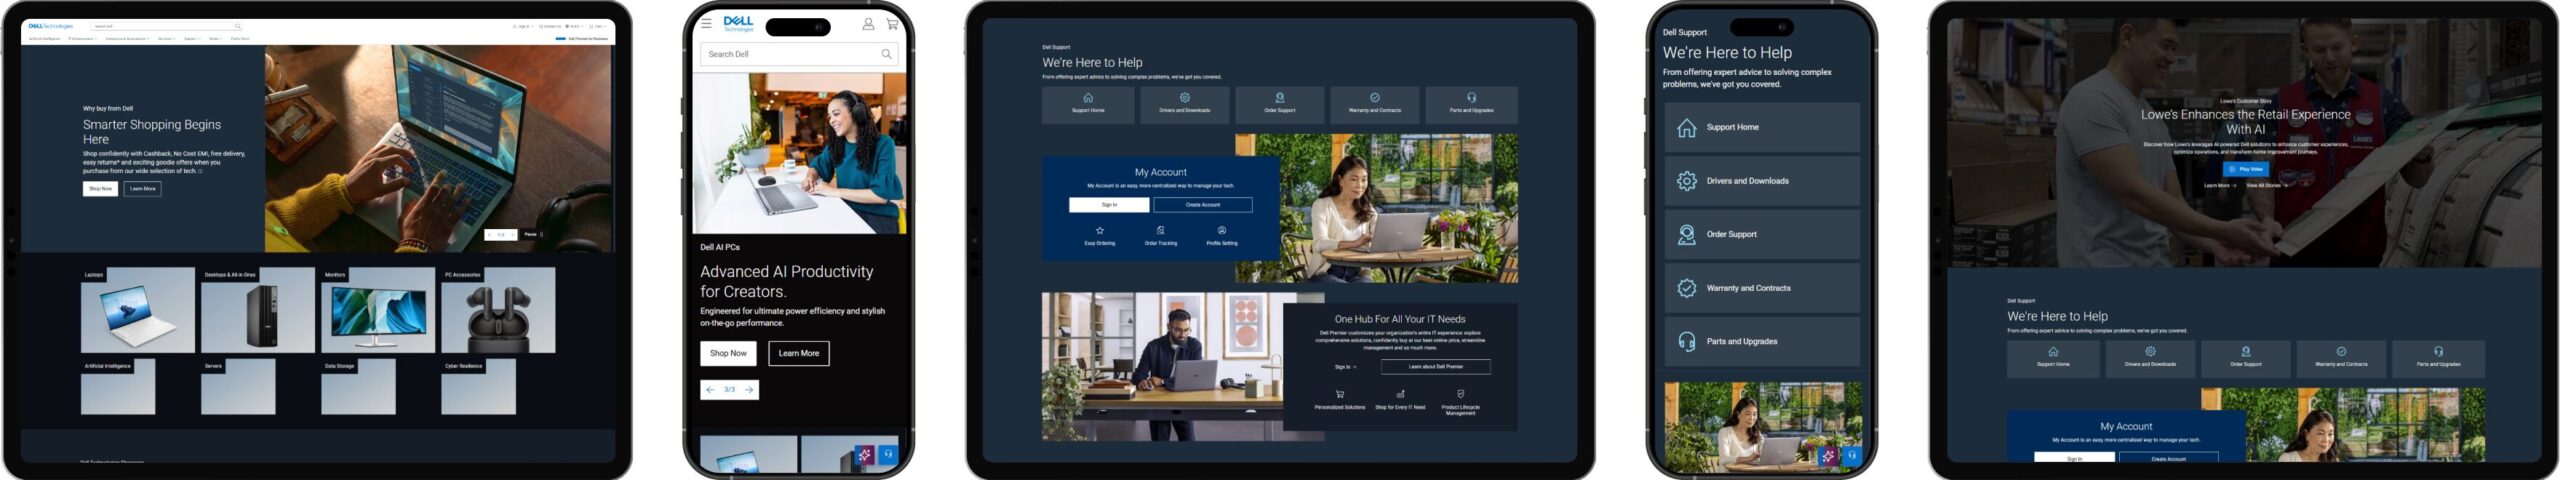
Mobile Overview
 Objective & Project Scope
The objective of this project was to build a scalable and conversion-focused digital platform that simplifies product discovery, improves user engagement, and supports Dell’s global business operations.

Designed a clean, enterprise-grade interface focused on trust, usability, and product clarity.

Developed a responsive and scalable platform capable of handling high traffic and complex product data.

Structured extensive product listings, specifications, and solutions for easy discovery.

Optimized assets and layouts to ensure fast load times across global markets.
 Roles & Responsibilities
 Key Features
Clear and structured presentation of laptops, desktops, and enterprise solutions.
Intuitive menus and filters for easy product discovery.
Optimized performance across desktop, tablet, and mobile devices.
Flexible architecture supporting frequent updates and new launches.
 Project Challenges
The solution addressed challenges around scalable data processing, responsive dashboards, and intuitive data visualization.

Handling large volumes of server metrics Solution: Used efficient data processing pipelines and caching mechanisms in Python.

Ensuring dashboard responsiveness Solution: Implemented React state optimization and lazy rendering of components.

Presenting complex data in a simple way Solution: Used clean UI layout and intuitive visual charts to highlight key insights
A visual breakdown of the design, development, and performance
that shaped the final product.
 Project Approaches
Performance Data Aggregation: Developed backend services in Python to collect and normalize server performance metrics.
Interactive Dashboard UI: Built a visual dashboard in React.js for real-time monitoring and analysis.
Advanced Charting & Data Visualization: Implemented graphical components using chart libraries to represent trends, utilization patterns, and alerts.
Server Health Insights: Generated analytics-based recommendations to detect potential performance issues early.
Custom Filters & Search: Allowed users to filter servers by location, usage patterns, and hardware type for quick decision-making.
This approach focused on keeping things simple, reliable, and ready to grow with Aftom AI needs.


Provided real-time insights into device performance and usage patterns.

Reduced manual workload with automated and centralized device management.

Enabled smarter maintenance and customer service strategies using actionable analytics.

Supported thousands of connected devices seamlessly without compromising system performance.


Get In touch
Our Testimonials:


Let Aviox Technologies give your idea the edge it deserves — with a free: